Project:     Indoor Weather Station
Status:      Complete, ongoing improvements
Comp. Date:  December 2023
Notice:      Project entry added retrospectively a year after completion
An esp8266 project I started at the end of 2023. It has a particulate matter and temperature sensor, and reports to my selfhosted influxdb over WiFi. I created scripts to process and graph the indoor and outdoor weather, namely temperature readings.
Unfortunately, I did not document (very well) the design and creation process. Below are what I had written in some places online as well as a general rundown. Additionally, some of the missing bits of information are filled in by memory.
Overview Changelog Additional Information
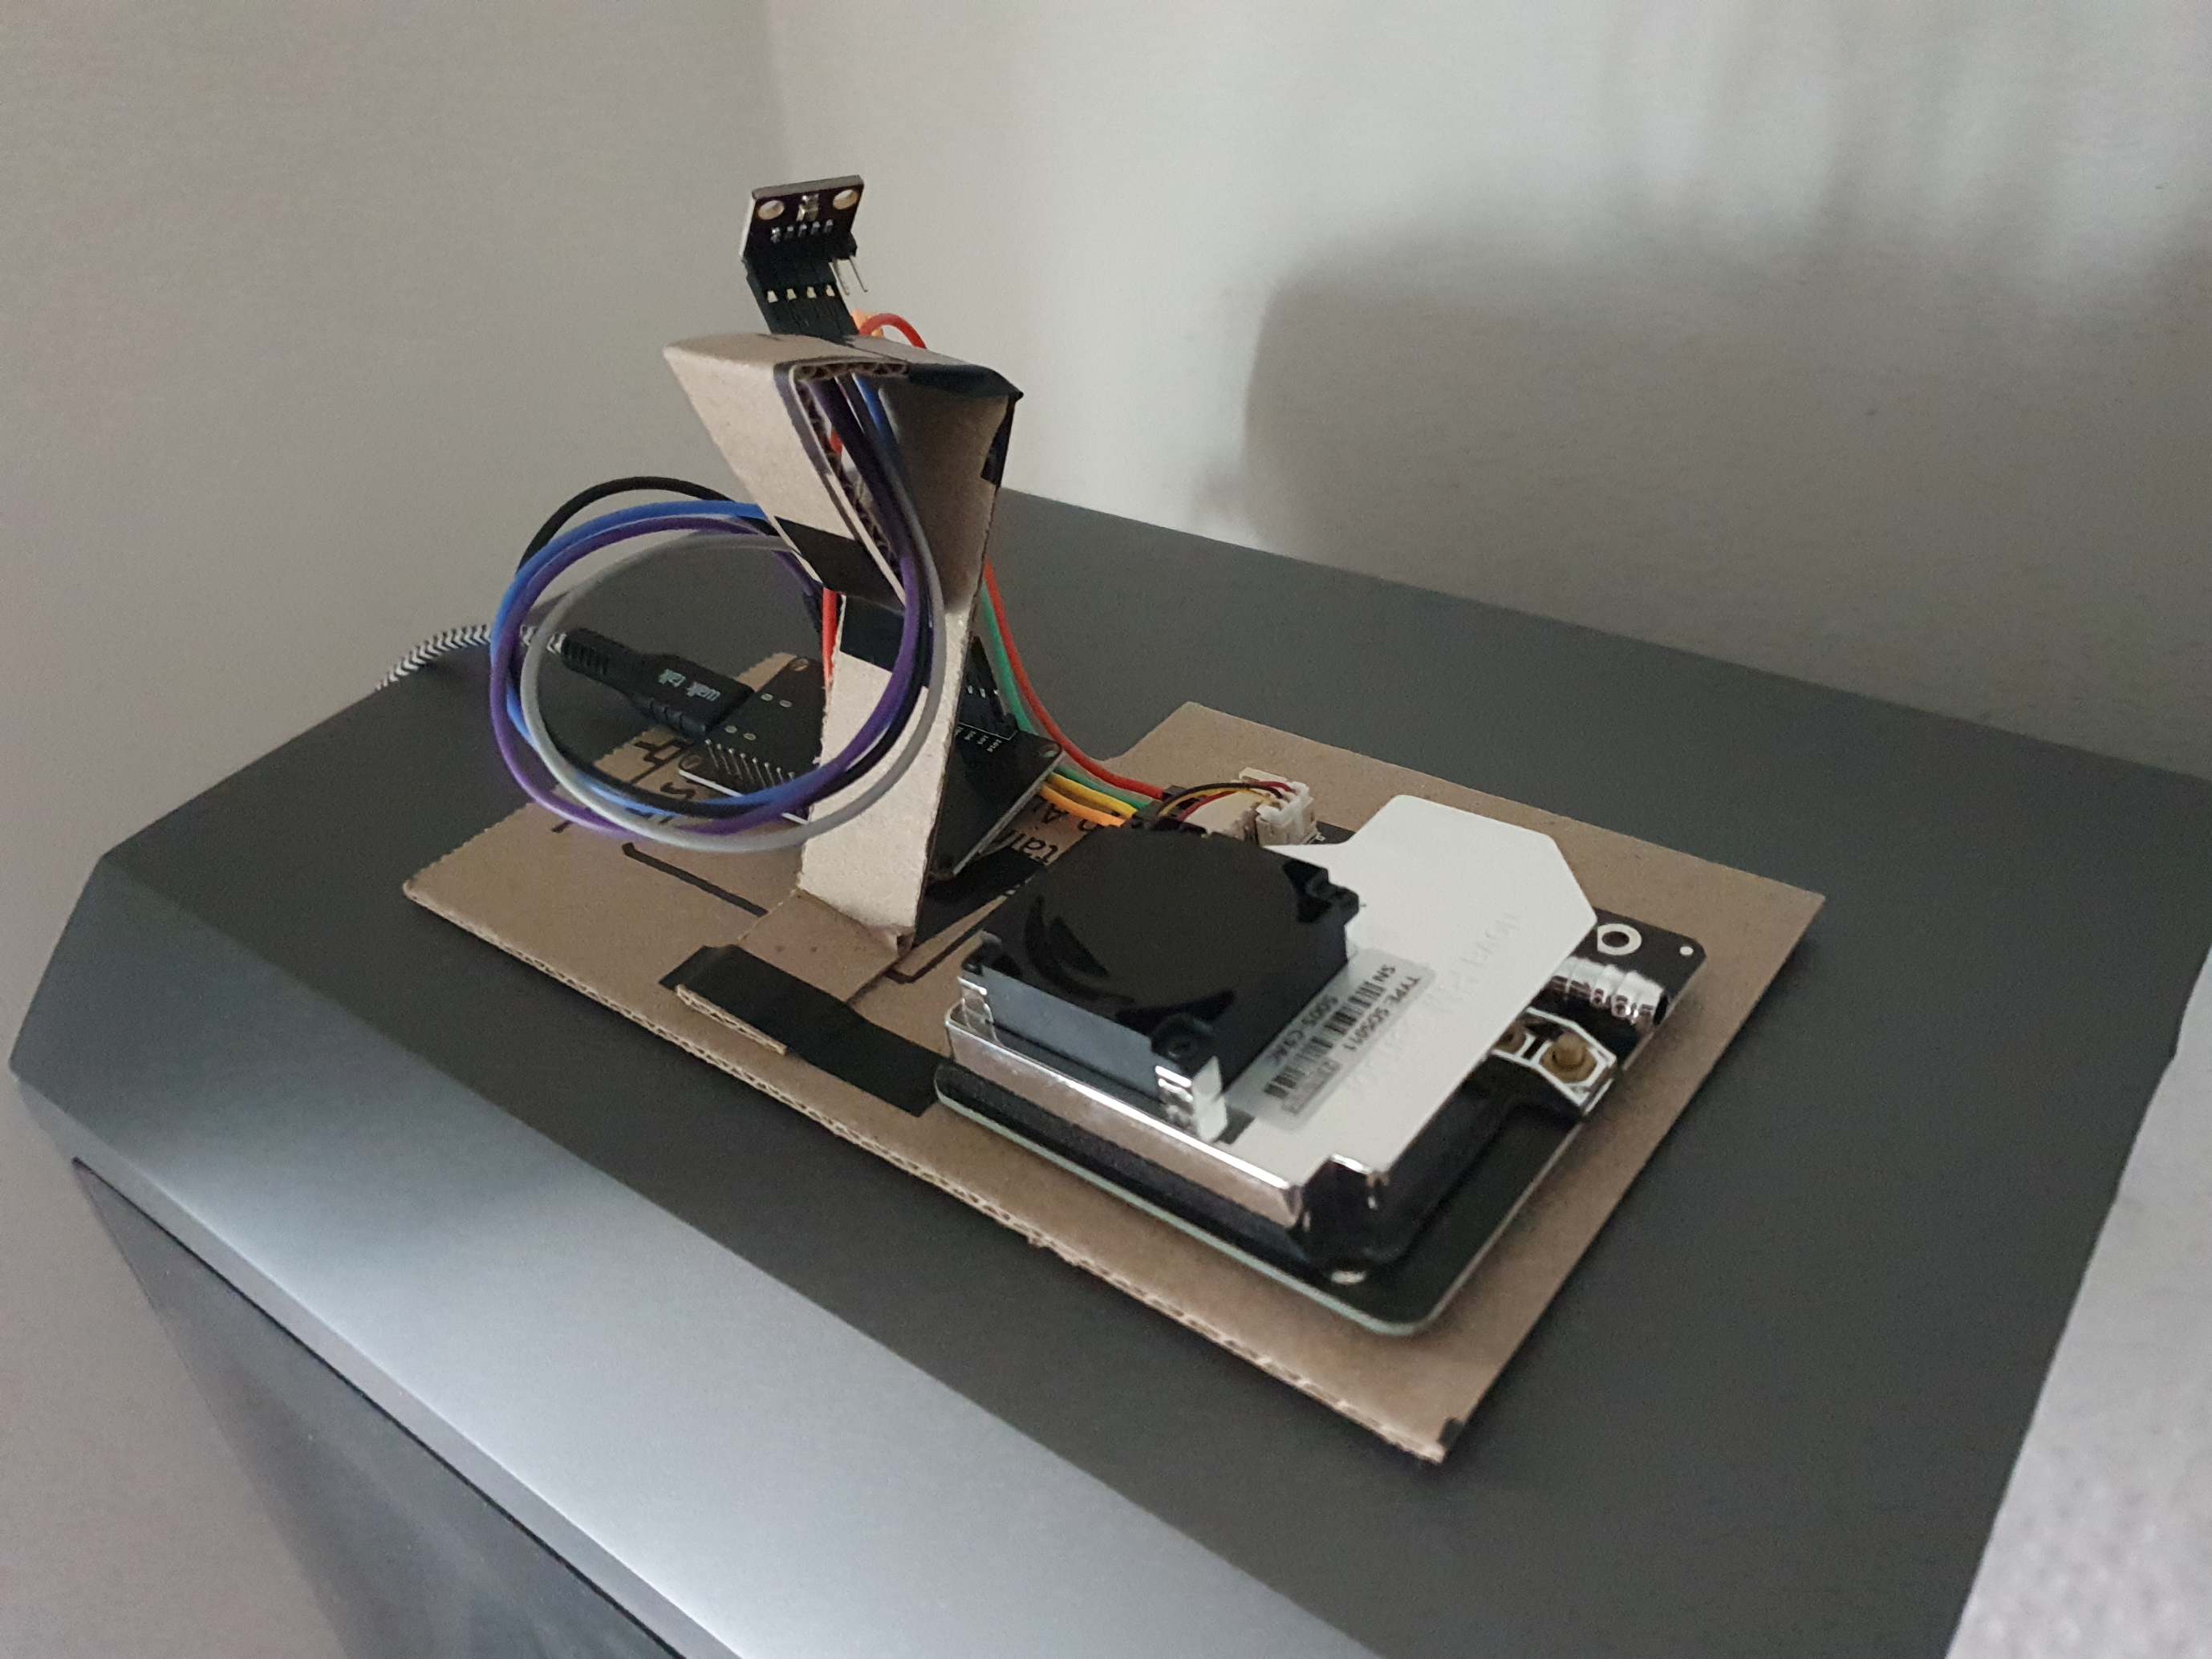
The station consists of a BME280 temperature/humidity sensor and a SDS011 particulate matter (PM) sensor, both wired to an esp8266. The esp8266 runs a FOSS sensor aggregator and pushes the results to databases via its API. It uses the sensors-software.
The design was mostly copied from a guide^[https://sensor.community/en/sensors/airrohr/] I followed with a few minor tweaks. Notably, it differs in that it does not use permanent wire connections, the PM sensor does not have a PVC tube, and that the software does not report to the default air quality database but rather to a custom solution involving an unsupported influxdb version.
On 9th of February 2024, I posted to sensor community explaining how I had setup my weather station to report to my selfhosted influxdb server. It includes a screenshot of my configuration as well as a link to the relevant github issue. Essentially, a backwards compatible API authorisation needed to be created manually, as the station’s software couldn’t support the newer influxdb v2 API authorisation.
I was able to get influxdb v2 working by following the this comment on github.
Basically, the sensor firmware tries sending the data using v1 of the influxdb api so you have to make a user that uses the v1 auth. Like this:
$ influx v1 auth create --username 'username' --write-bucket 'bucket-id' --password 'password' --org 'Org Name'
$ influx v1 dbrp create --bucket-id (from above) --db feinstaub --org 'Org Name' --default --rp feinstaub
apuls, GitHub
Here’s my sensor configuration and how it looks in influxdb.
picture of my config
(I can only post one image for now, as I’m new…)
Happy to help anyone wanting to get it working with influxdb v2 :slight_smile:
https://forum.sensor.community/t/particulate-matter-sensor-does-not-push-data-to-influxdb/2421/11 (12, 13, & 15)
v0.2 2024
I switched from using influxdb’s charts to self hosted grafana. Not much of my own documentation exists
v0.3 2024-12-30
I upgraded the station’s enclosure to a custom crafted cardboard box that goes over the components while also allowing for airflow for the PM sensor, but not too much to disrupt temperature sensor from reading ambient air temperature.
To get the 7d temperature chart data I use this flux code:
import "math"
import "date"

from(bucket: "influx")
  |> range(start: -7d, stop: date.truncate(t: now(), unit:30m))
  |> filter(fn: (r) => r["_measurement"] == "feinstaub")
  |> filter(fn: (r) => r["_field"] == "BME280_temperature")
  |> filter(fn: (r) => r["node"] == "esp8266-15514816")
  |> aggregateWindow(every: 30m, fn: mean, createEmpty: false)
  |> timeShift(duration: -30m)
  |> drop(columns: ["table", "result", "_measurement", "node", "_field", "_start", "_stop"])
  |> map(fn: (r) => ({r with _value: math.round(x: (r._value * 10.0)) / 10.0}))
A Codeberg repository (https://codeberg.org/Alliegaytor/temp-charter), “temp-charter”, exists as a collection of scripts to retrieve and parse data from influxdb, as well as retrieving weather information from pirate weather, and also graphing both datasets.
The station uploads data to the madavi API in addition to the self hosted influxdb server. The grafana site for the database is here^[https://api-rrd.madavi.de:3000/grafana/d/q87EBfWGk/temperature-humidity-pressure?var-chipID=esp8266-15514816&var-type=BME280&var-query0=sensors&orgId=1]. Whilst primarily serving as an independent backup and externally accessible resource, data can be exported from the grafana charts for use in the local database (see below).
The data can be exported by:
Sometimes, usually in the case of a VM crash, sensor data is recorded to the madavi api only. This data can be exported and then manually uploaded to influxdb via csv imports.
There exists a template csv file in the “temp” repo that is correctly formatted for this, with the only things needing to be changed being the sensor data, datetimes, and sensor name.
The unix timestamps from the grafana sensor data can be converted to the appropriate datetime format using the times.py python script.
The following are the docker compose files for the influxdb and grafana containers.
volumes:
    influxdb:
    influxdb_etc:

services:
  influxdb:
    image: influxdb:2
    container_name: influxdb_weather
    restart: unless-stopped
    environment:
      - INFLUXD_REPORTING_DISABLED=true
      - DOCKER_INFLUXDB_INIT_MODE=setup
      - DOCKER_INFLUXDB_INIT_BUCKET=influx
      - DOCKER_INFLUXDB_INIT_ORG=org
      - DOCKER_INFLUXDB_INIT_USERNAME=aly
      - DOCKER_INFLUXDB_INIT_PASSWORD=PASSWORD
      - DOCKER_INFLUXDB_INIT_ADMIN_TOKEN=TOKEN
    ports:
      - '8086:8086'
    volumes:
      - influxdb:/var/lib/influxdb2
      - influxdb_etc:/etc/influxdb2
volumes:
  grafana-storage: {}

services:
  grafana:
    image: grafana/grafana-oss
    container_name: grafana
    restart: unless-stopped
    environment:
      - GF_ANALYTICS_REPORTING_ENABLED=false
      - GF_ANALYTICS_CHECK_FOR_UPDATES=false
      - GF_ANALYTICS_ENABLED=false
      - GF_ANALYTICS_CHECK_FOR_PLUGIN_UPDATES=false
      - GF_SECURITY_DISABLE_GRAVATAR=true
    extra_hosts:
      - "grafana.com:0.0.0.0"
    ports:
      - '3000:3000'
    volumes:
      - grafana-storage:/var/lib/grafana